Dynamic Analysis
What is Dynamic Analysis
Static Analysis calculations are performed assuming the belt is a rigid body and does not stretch whereas Dynamic Analysis is based on a flexible belt model which allows the belt to stretch and contract and it calculates the transient belt Tensions and Velocities during starting and stopping of a conveyor under different loading conditions.
The Dynamic Analysis results provide a more accurate representation of the actual peak belt Tensions in the system during starting and stopping – Dynamic Tensions are often 20% higher than the belt tensions obtained using Static Analysis only.
Dynamic analysis is also required to analyse the behavior of long conveyor belts during stopping - often low belt tensions can develop during loaded stopping which results in excessive belt sag and material spillage and a full Dynamic Analysis of the conveyor will allow the designer to adjust the conveyor equipment in order to design out any problems.
Helix Dynamic Analysis Calculation Method
The Dynamic calculation process uses sophisticated Variable Step Runge Kutta method integrators for solving the complex differential equations.
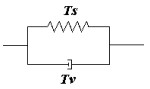
Helix DeltaT uses a Finite Element model of the conveyor to perform the dynamic analysis. The conveyor is broken up into segments, and for each segment, we use a Kelvin solid model, which is a spring in parallel with a viscoelastic element, as shown below:
Kelvin Solid Model
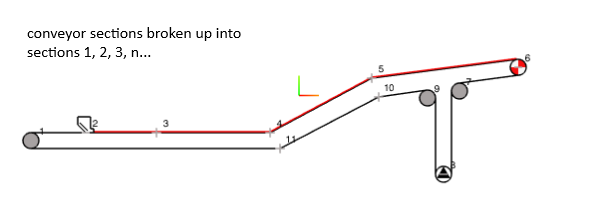
Conveyor Model Diagram
The conveyor model created in the DeltaT Online program is automatically broken up into segments in the Dynamic Calculation process. The program already knows the geometry of each section of conveyor, as well as the idler spacing, rotating masses, resistances, inertias, drive power and location, takeup mass and the equivalent mass of each element in the conveyor. The Dynamic calculation breaks the standard conveyor sections into smaller segments and the lengths can be specified by the user.
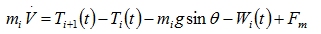
DeltaT uses the Finite Element method of dynamic analysis. Once the conveyor is segmented, the moving mass, length etc. of each segment is known. The Tension force acting on segment i at time t is given by the sum of the spring and viscoelastic Tension forces, Ts and Tv respectively. At each time step of say 0.1 seconds, the rate of change of velocity, combined with the strain on each conveyor segment is calculated. The peripheral force at the drive pulleys is the motivating force.
The main conveyor resistances, represented by the Coulomb friction factor f, which is a function of instantaneous belt tension and belt sag at the segment under consideration, are taken into account. All idler roller rotating masses and pulley, drive and brake inertias are included in the acceleration and tension calculations. The Drive Torque or Velocity is input graphically, and the resulting Belt Tensions, strains and belt Velocities are output for each time step and for each point along the conveyor. These values are presented graphically for ease of interpretation.
Use Cases and Features
Generally speaking Dynamic Analysis (DA) is used to investigate the conveyor during starting and stopping under the different loading conditions. The user can enter different starting and stopping control and view the results.
Why Use Dynamic Analysis?
- Model the belt tensions and velocities
- Calculate Dynamic Runback forces and size holdbacks for dynamic loads.
- View the movement distance movement speed of the Take up pulley
- Predict the maximum Transient Belt Tensions at any point along the conveyor as well as the timing
- Calculate the torque loadings on gearboxes, holbacks and couplings during starting and stopping. Eliminate conditions which may cause costly equipment failures
- Optimize Starting and Stopping Control
- Determine Starting and stopping times and compare with static analysis results
- Determine if the belt sag during stopping is an issue
- Determine likelihood of belt slip
- Determine if the belt will run backwards during a stop
Features
- Add Torque Control or Speed Control on drive acceleration
- Add Delay times for multiple drives for Dynamic Tuning
- Add Flywheels to drive pulleys to optimise starting and stopping
- Add Brakes to pulleys as required
- Starting Control Techniques
-
- Torque Speed Control - Starting - e.g DOL, Wound Rotor, Fluid Coupling
- Speed Time Control - Starting e.g VVVF Variable Speed Drives, DC Motors
- Stopping Control Techniques
-
- Constant Torque Brake - Stopping e.g Disc Brake
- Speed Time Curve Control - Stopping e.g VVVF Controlled stop (ramp down)
- The Take-up can be locked on stopping to use belt stretch tension for sag control
Examples
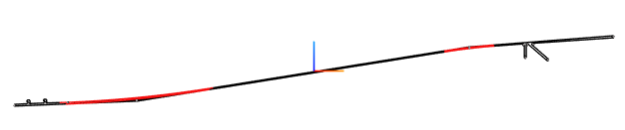
This is a 290m long conveyor with 33m of lift transporting 9400tph of material at 4.3m/s.
Profile sketch Drawing
Scale Drawing
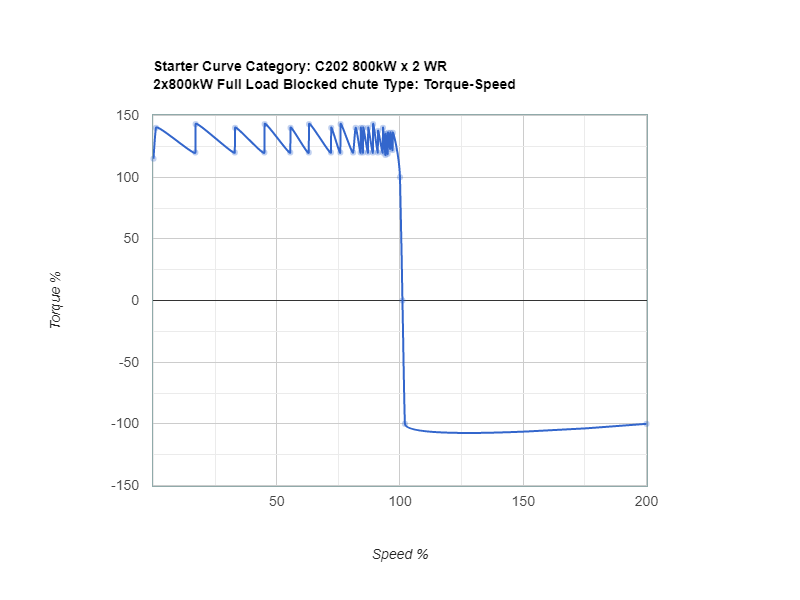
Starting Control - Wound Rotor motor Torque Speed Graph
Results
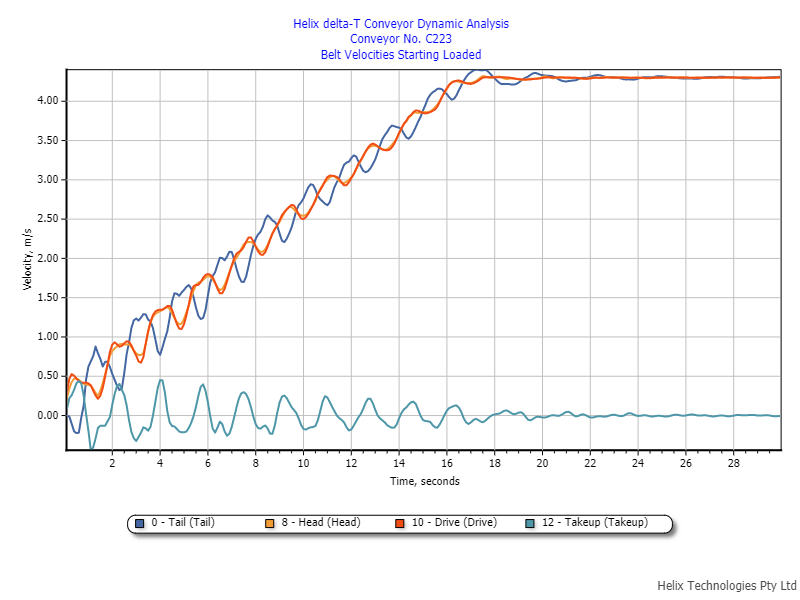
Velocity Graph Starting
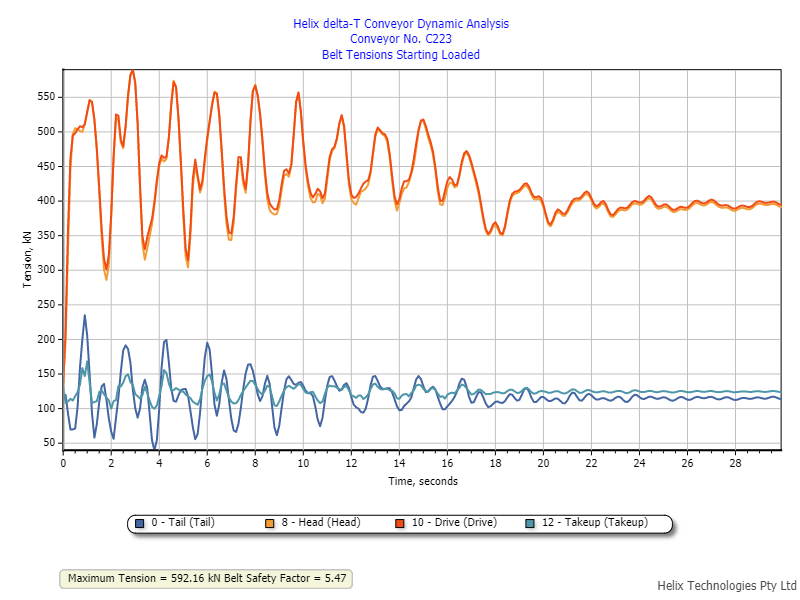
Tensions Graph Starting
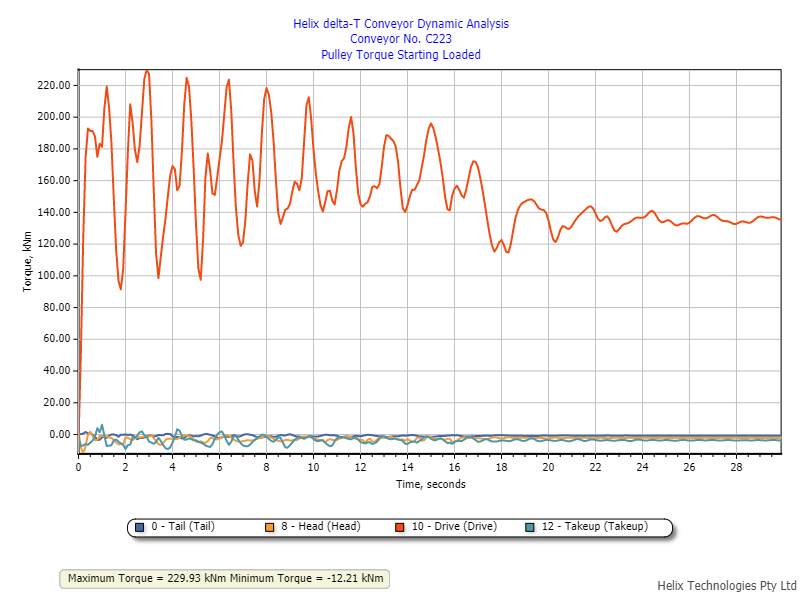
Pulley Torque Graph Starting
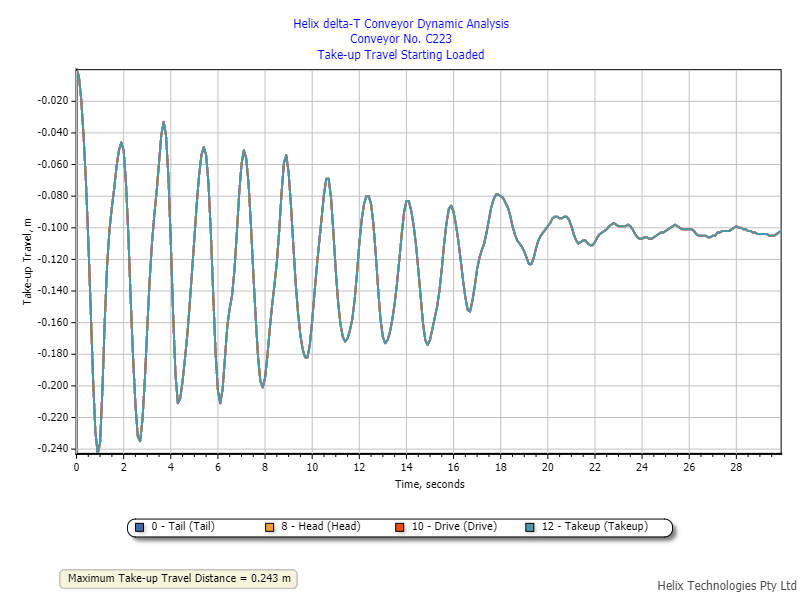
Takeup Travel Graph Starting
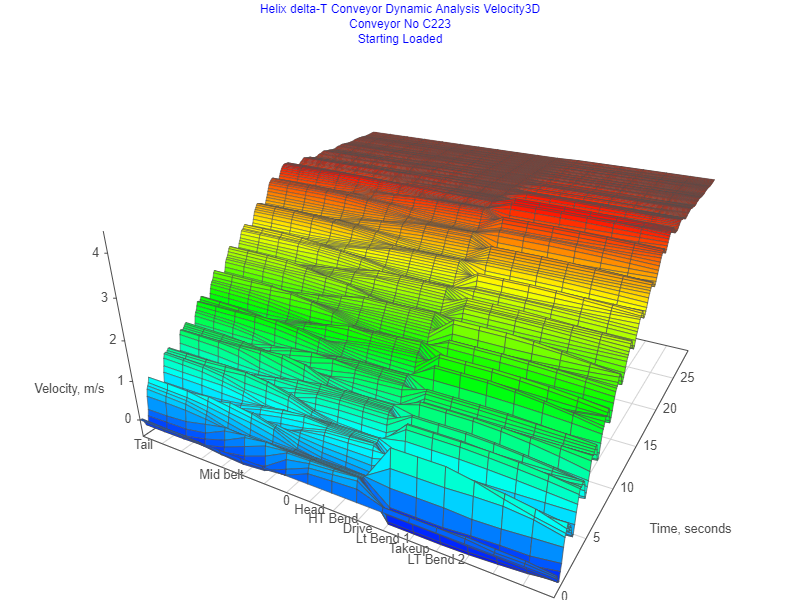
3D Velocity Graph Starting
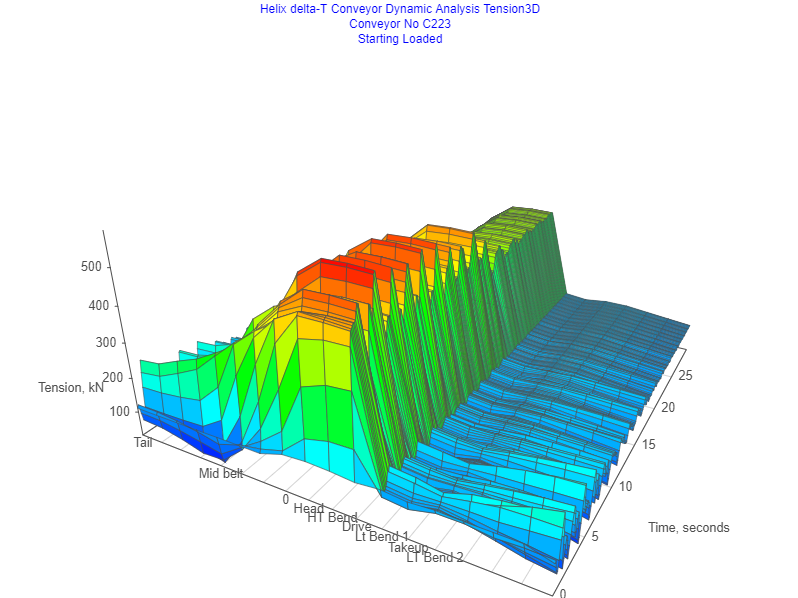
3D Tensions Graph Starting
Download the Example Report Here: Download Report
Register and Login (free) and view the Demo Conveyor Here: View Demo
Profile sketch and scale drawing is shown in the above example
Stopping Control - Constant Torque Brake 26.5kNm braking torque on the drive pulley
Results
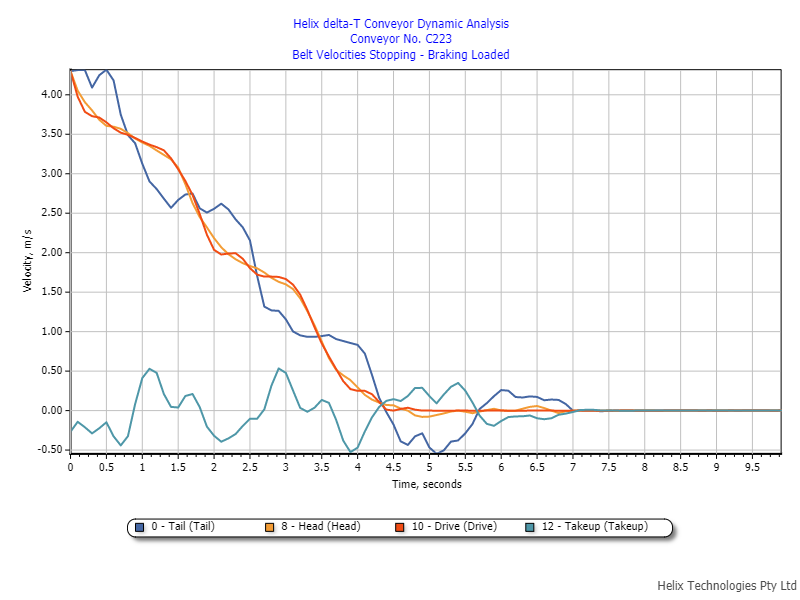
Velocity Graph Stopping Loaded
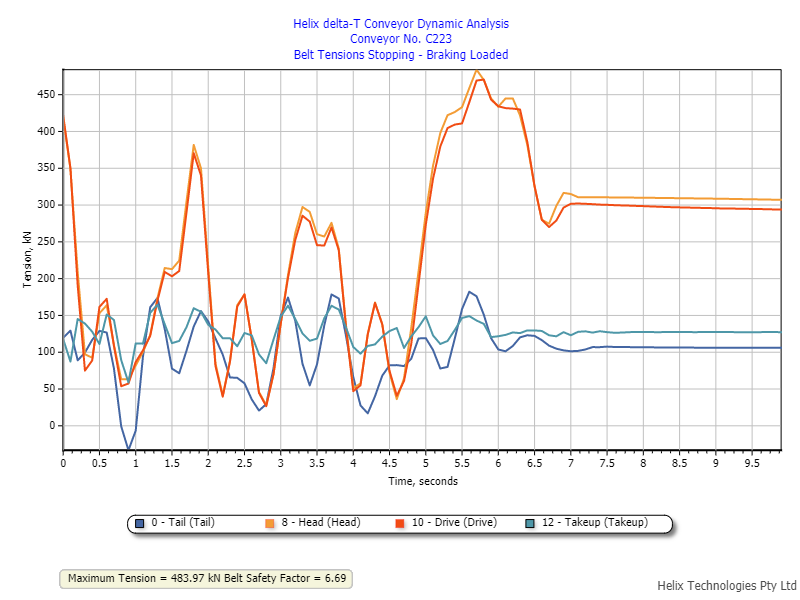
Tensions Graph Stopping Loaded
Note the tension rise at the drive at the 5.7 second mark - this is due to the Holdbacks locking up and preventing belt
runback.
Pulley Torque Graph Stopping Loaded
Takeup Travel Graph Stopping Loaded
3D Velocity Graph Stopping Loaded
3D Tensions Graph Stopping Loaded
Download the Example Report Here: Download Report
Register and Login (free) and view the Demo Conveyor Here: View Demo
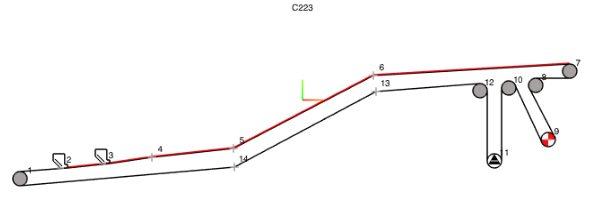
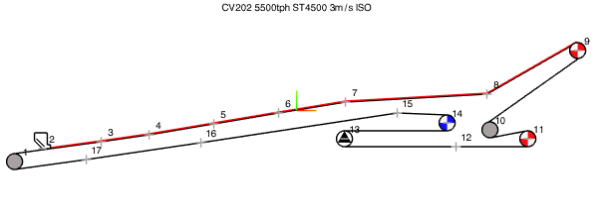
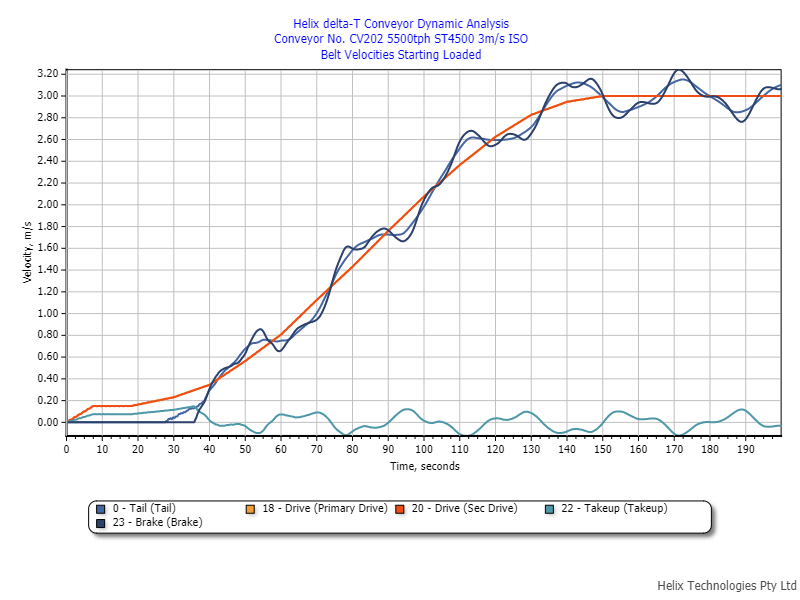
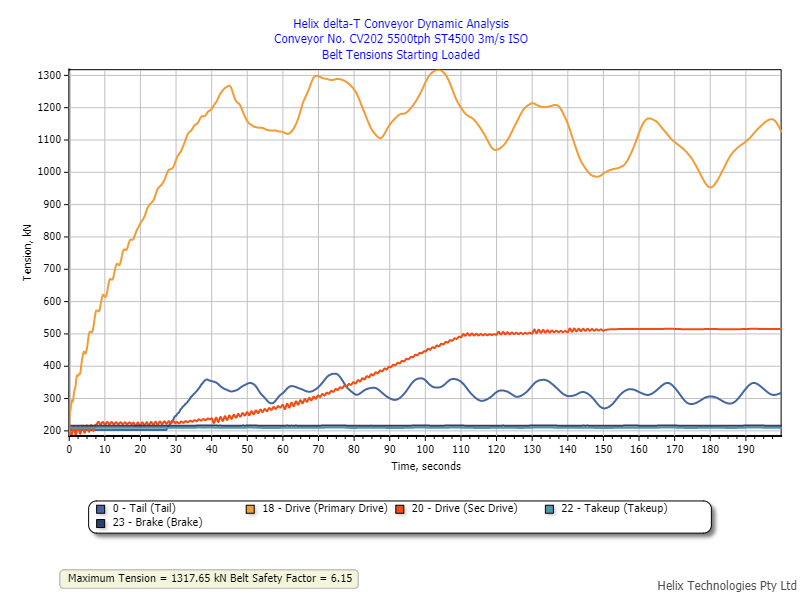
This is a more complex example with a 6.2km long conveyor transporting 5500tph of material at 3m/s belt speed. The conveyor has two drives with a total of 3000kW installed power and a Low speed brake pulley.
Profile sketch Drawing
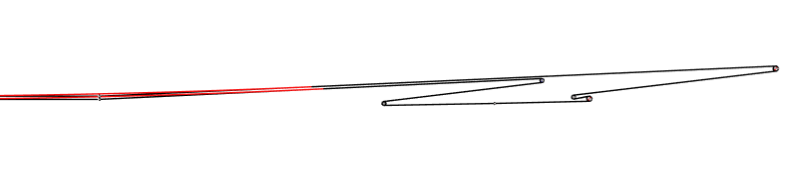
Scale Drawing of the Head of the conveyor
Starting Control - The conveyor has two drives.
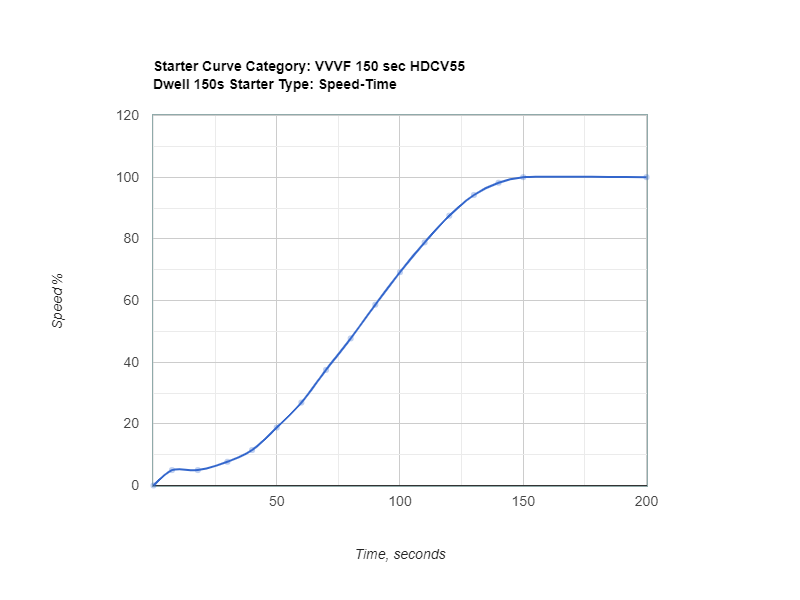
Primary Drive with two x 1000kW installed power is controlled using a VSD. The starting ramp is a speed time control and is a 150second start with a dwell period at the start.
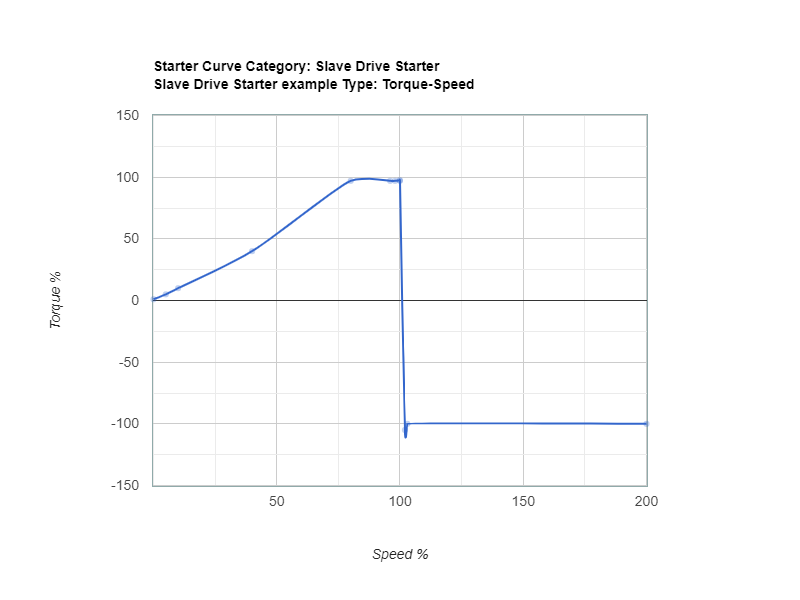
The secondary drive in this Dynamic analysis case needs to be a Torque Speed control type as it follows the primary drive.
Results
The calculation was performed for 200 seconds.
Velocity Graph Starting Loaded
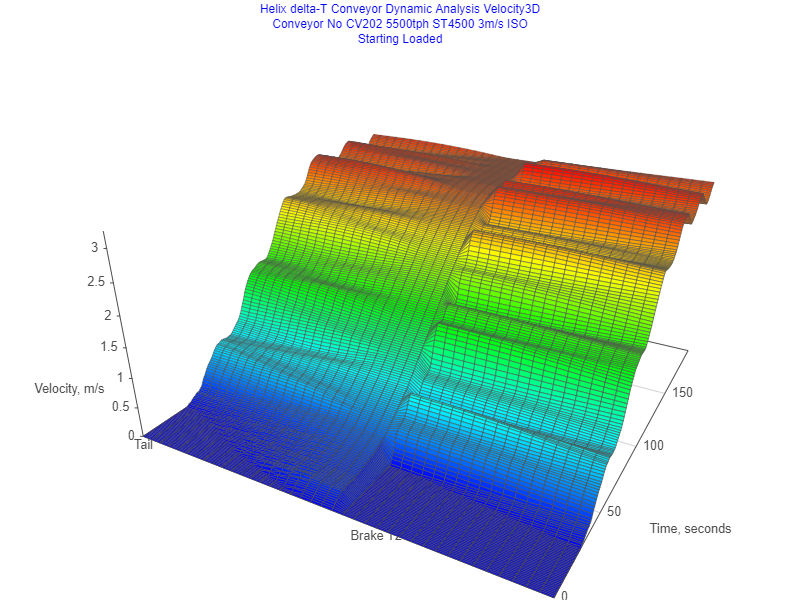
The belt at the primary drive follows the starting speed time ramp and starts in 150seconds.
The light blue line is the speed of the take up pulley itself and not the belt speed.
Tensions Graph Starting Loaded
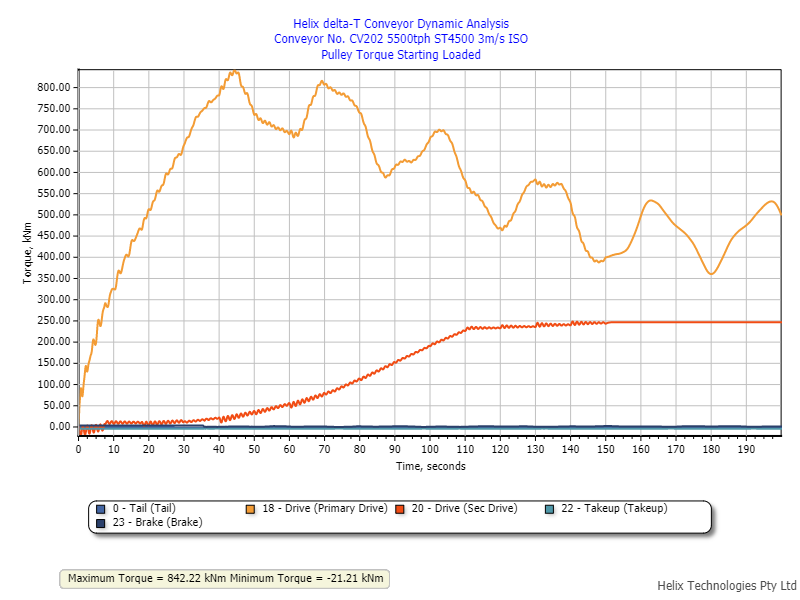
Pulley Torque Graph Starting Loaded
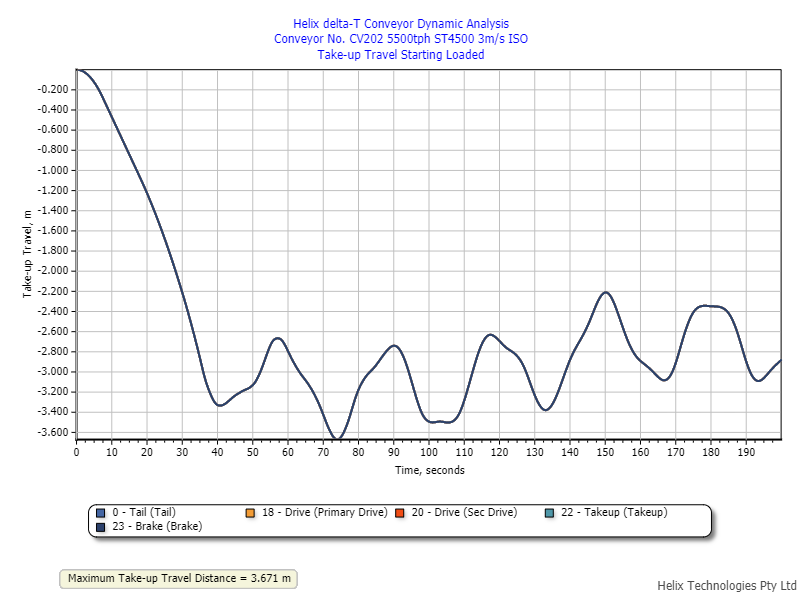
Takeup Travel Graph Starting Loaded
3D Velocity Graph Starting Loaded
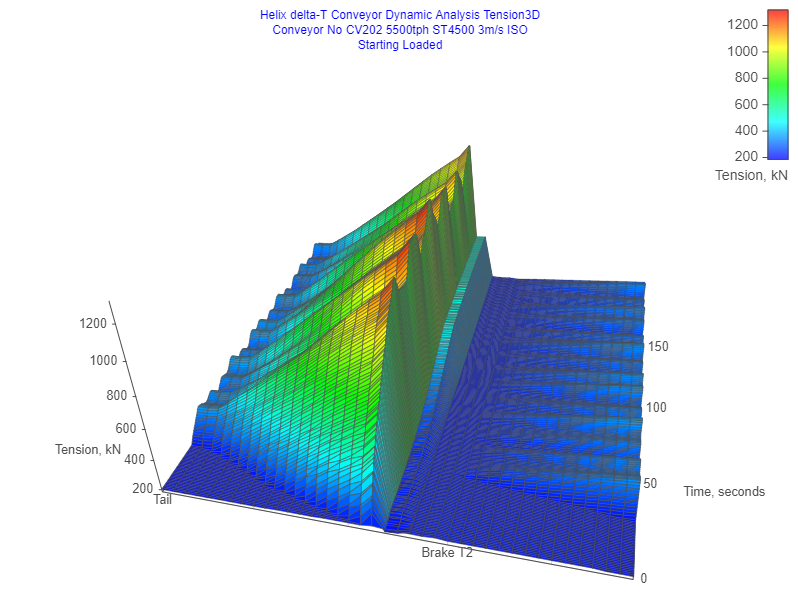
3D Tensions Graph Starting Loaded
Download the Example Report Here: Download Report
Register and Login (free) and view the Demo Conveyor Here: View Demo
This is a more complex example with a 6.2km long conveyor transporting 5500tph of material at 3m/s belt speed. The conveyor has two drives with a total of 3000kW installed power and a Low speed brake pulley.
Profile sketch Drawing
Stopping Control - The brake pulley is located after the take up. The Low Speed brake is a 70kNm constant torque brake. There is a holdback installed on both the primary and secondary drive to prevent the belt running backwards.
Results
The calculation was performed for 25 seconds.
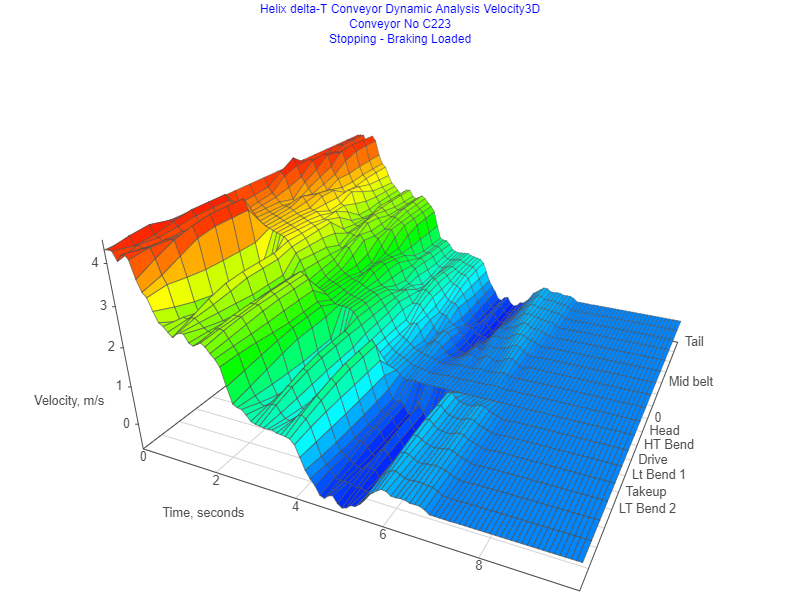
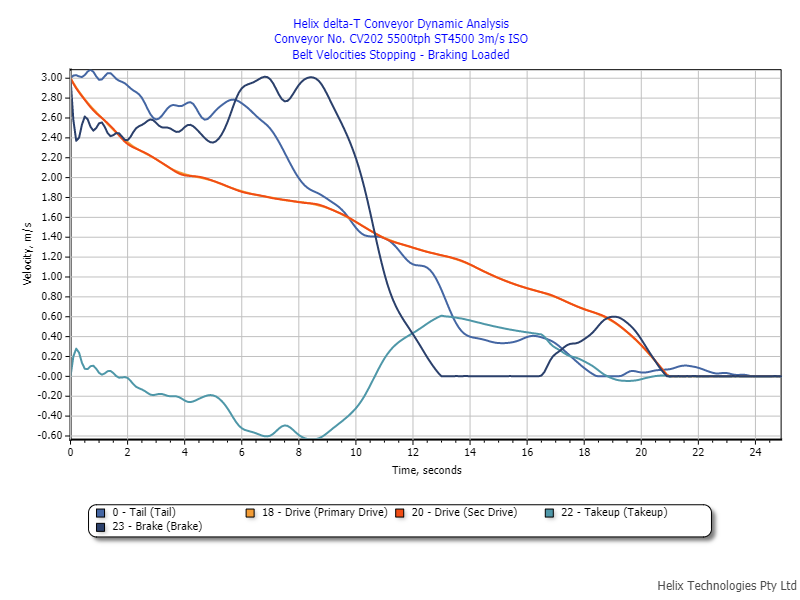
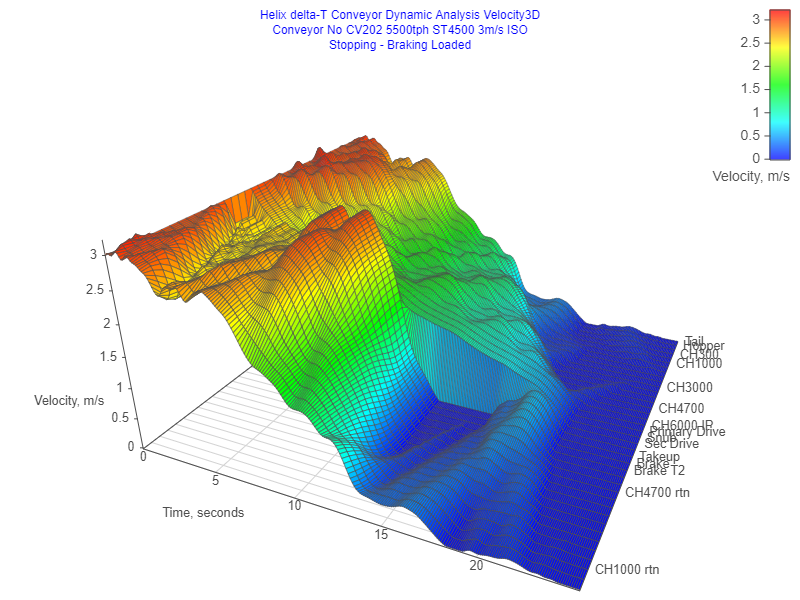
Velocity Graph Stopping Braking Loaded
The belt at the drives come to a complete stop at 21 seconds. The light blue line is the speed of the takeup pulley moving (not the belt speed).
The belt at the tail starts decelerating after about 1.75 seconds.
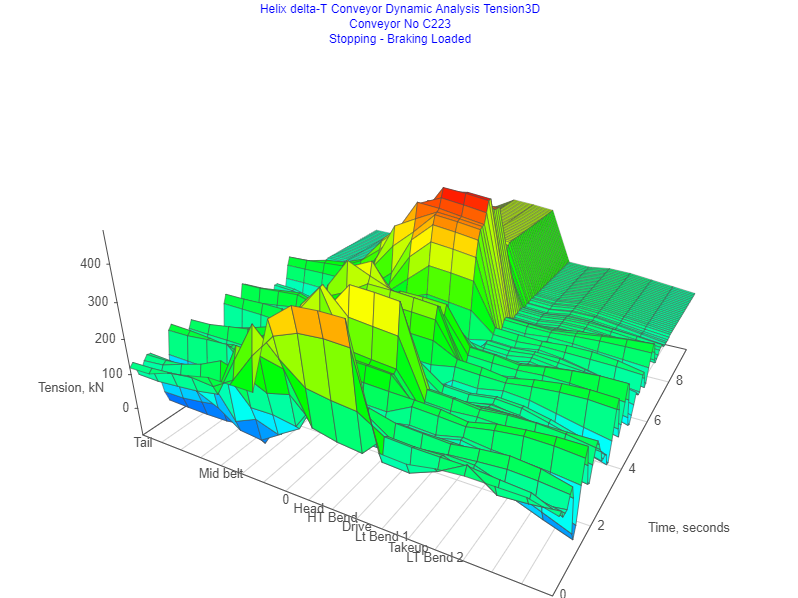
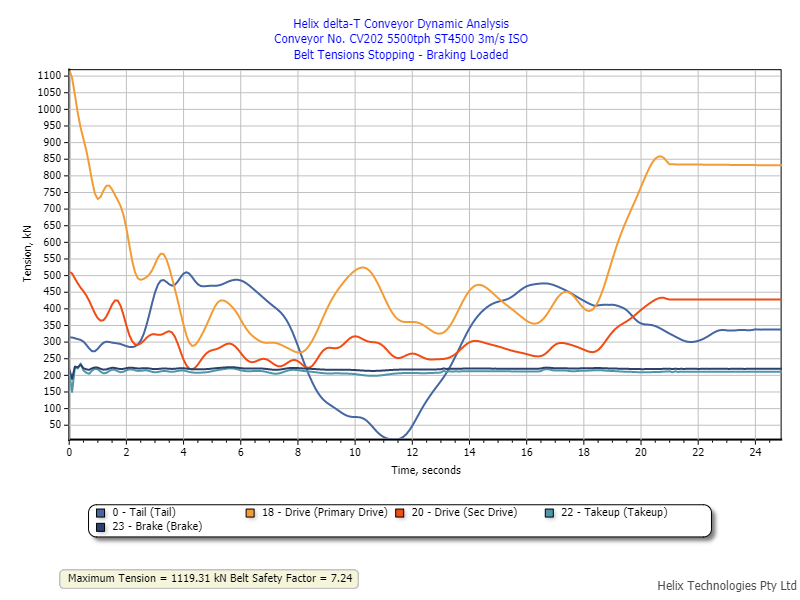
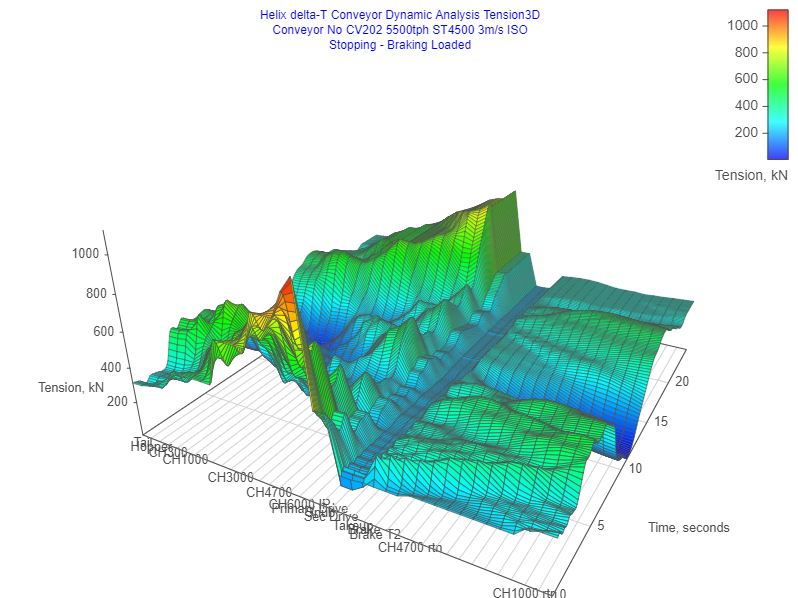
Tensions Graph Stopping Braking Loaded
Belt tensions at the Primary and secondary drive drop quickly from running state after the drive power is cut.
The rise in tension at the Primary and Secondary drives is due to the holdbacks locking up once the belt has come
to a stop.
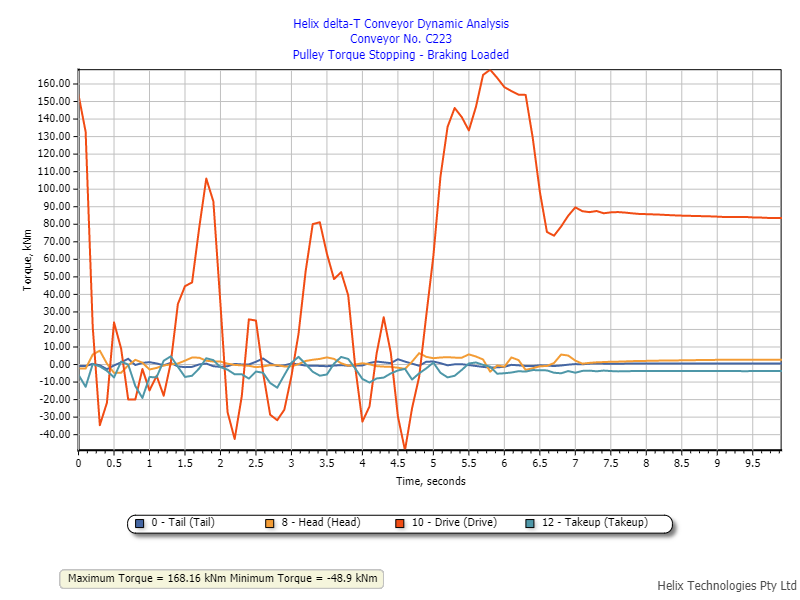
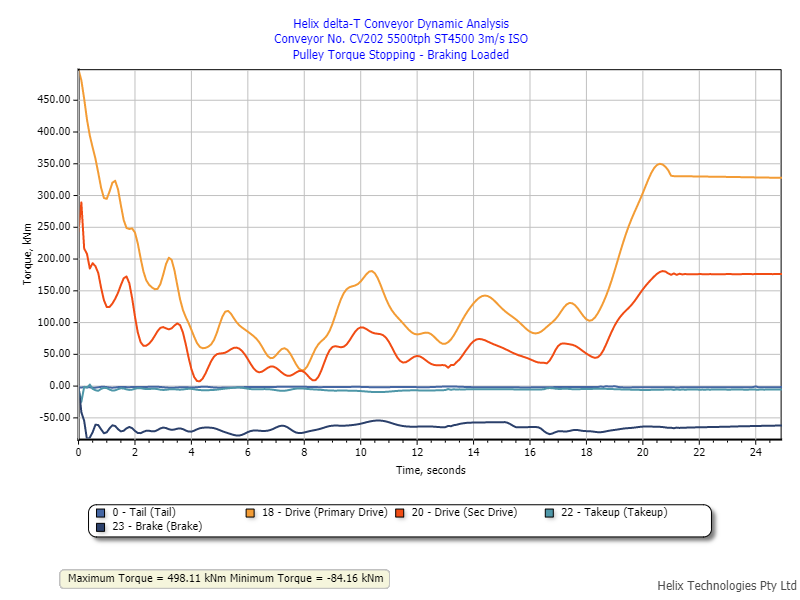
Pulley Torque Graph Stopping Braking Loaded
Primary drive pulley peak torque is 350kNm and occurs as the holdback is locking up. Secondary drive peak torque is 181kNm.
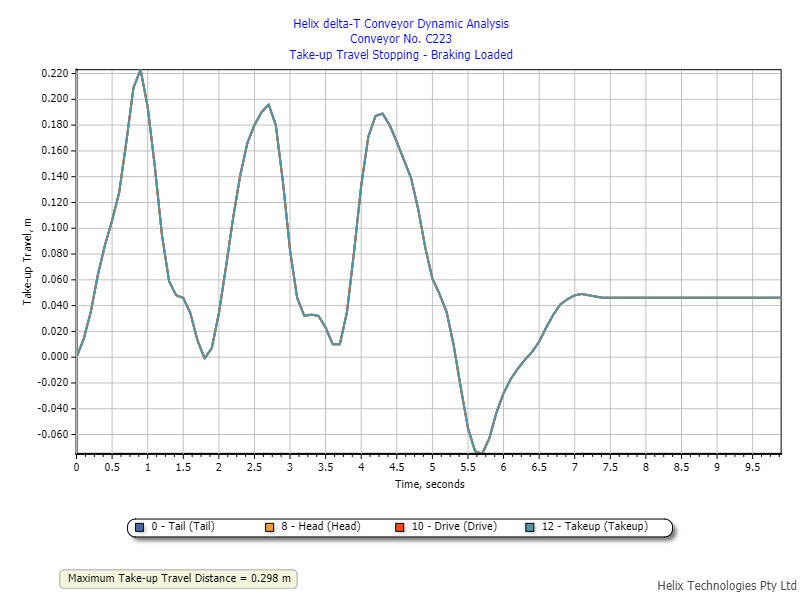
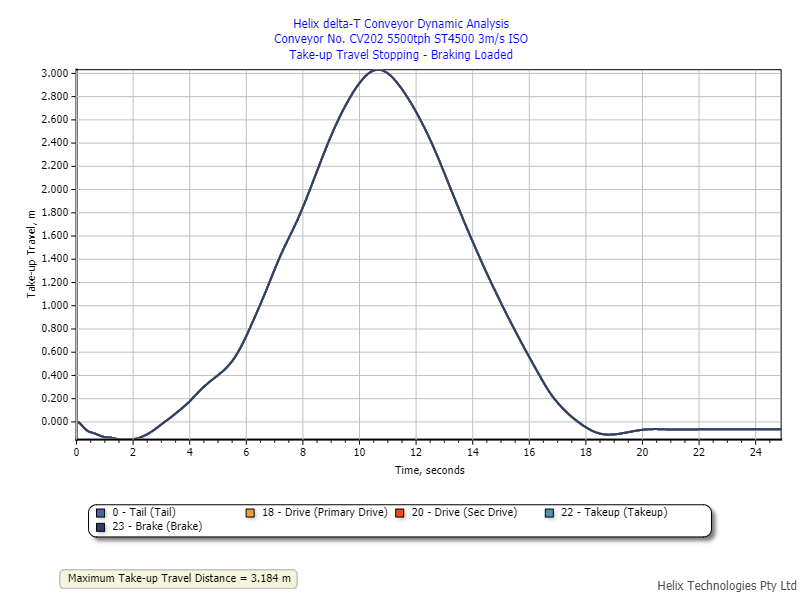
Takeup Travel Graph Stopping Braking Loaded
3D Velocity Graph Stopping Braking Loaded
3D Tensions Graph Stopping Braking Loaded
Download the Example Report Here: Download Report
Register and Login (free) and view the Demo Conveyor Here: View Demo
Read more about the Dynamic Analysis calculations in the Help page.